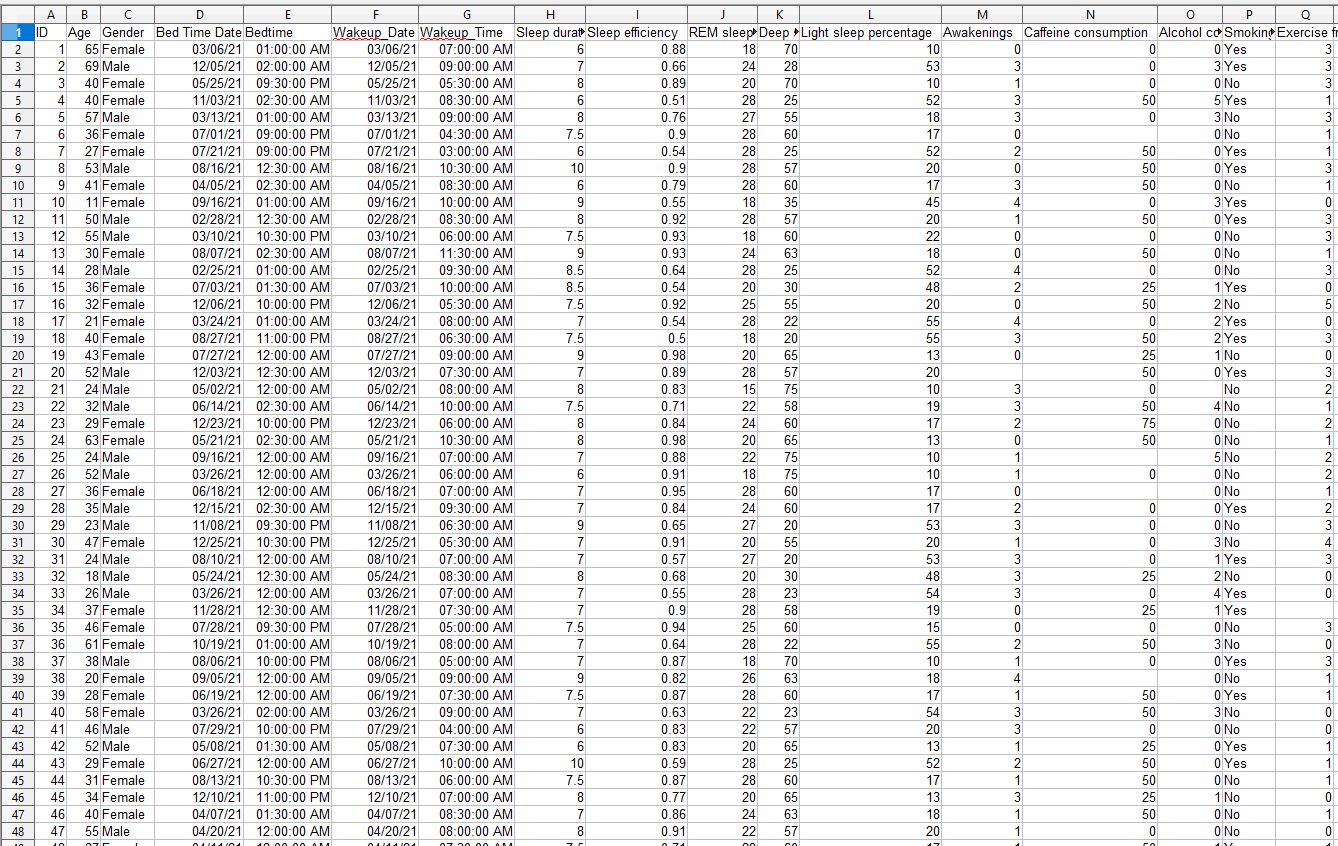
DataBase
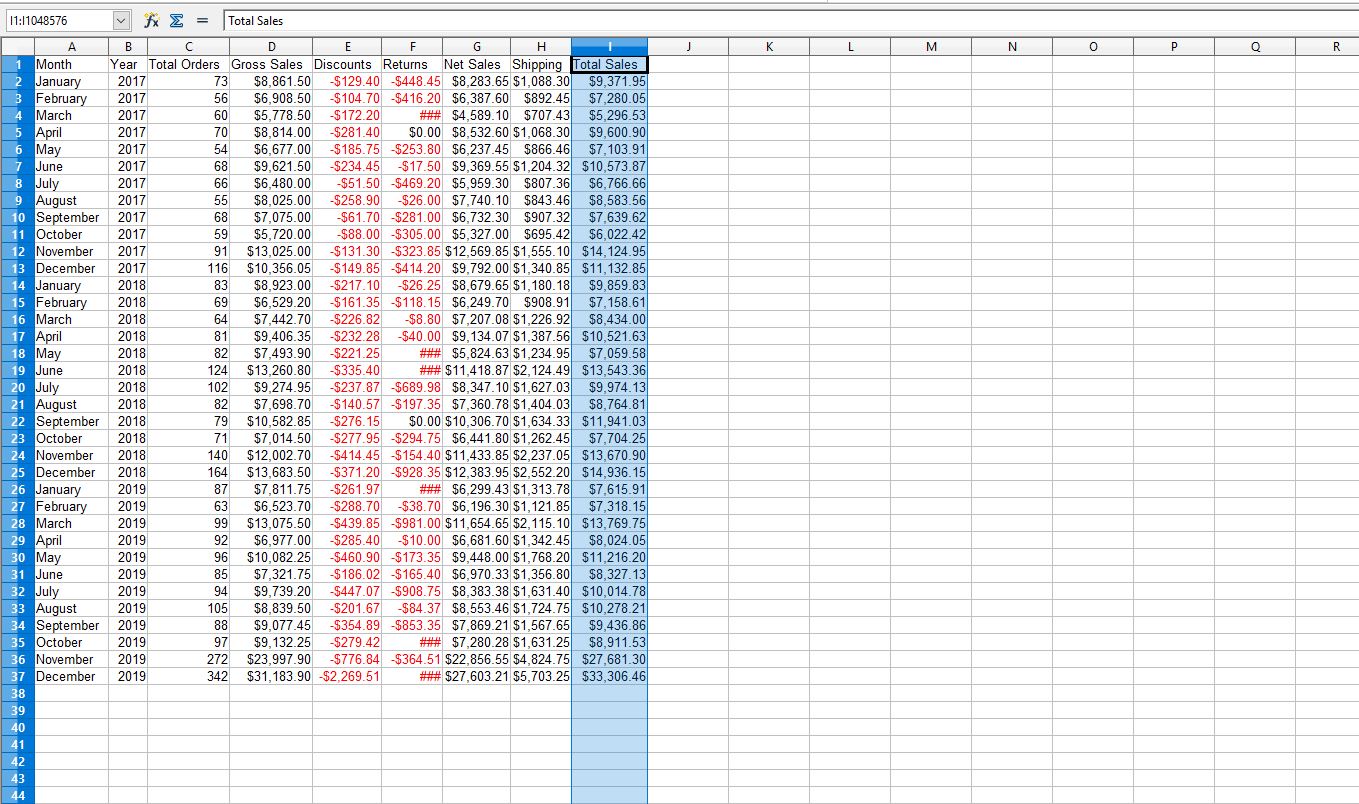
In order to get more experience with spreadsheets, I decided to experiment with some databases I found on Kaggle, specifically a database on the results of a sleep survey and a general finance database:
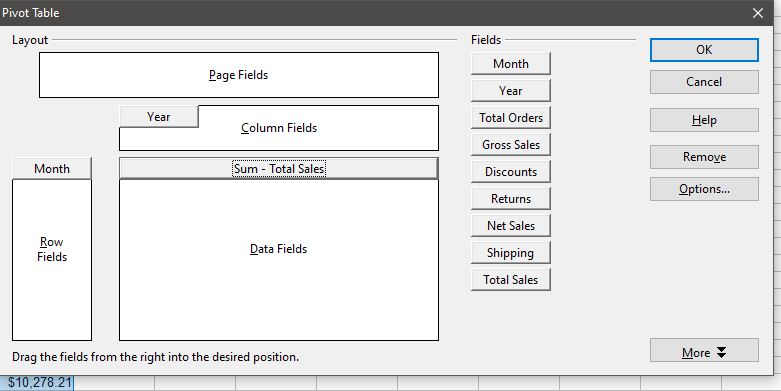
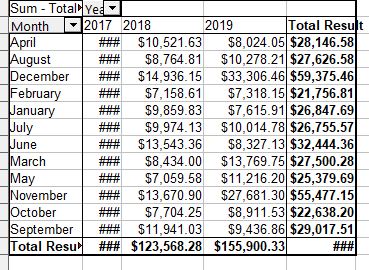
Pivot Tables
One of the first things I wanted to get the hang of was pivot tables. Pivot Tables are essentially simplified data tables that highlight the most important information.
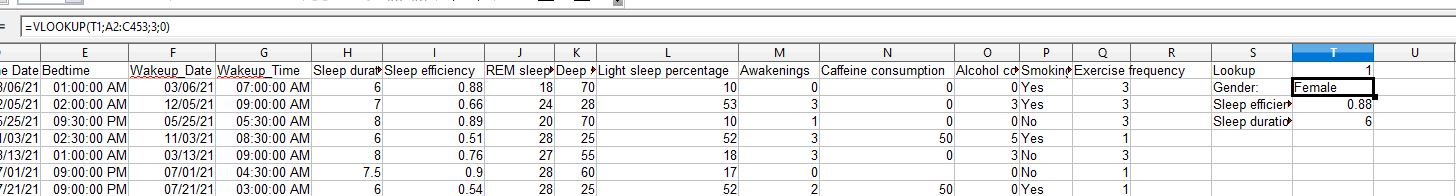
Vlookup
I also decided to use the VLOOKUP function, which is a function that will essentially give you the correlating data for the specified term, Typically the specified term is a data cell that can be used to search the database so that a user can modify the value of the searched term to affect the results.
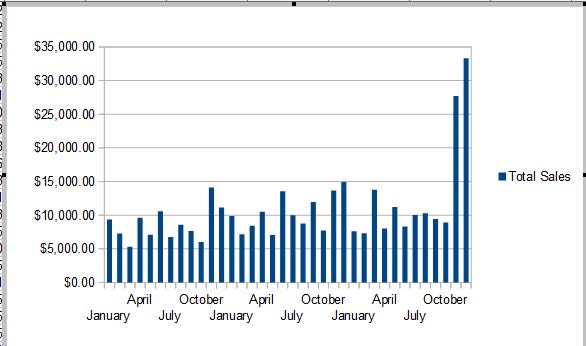
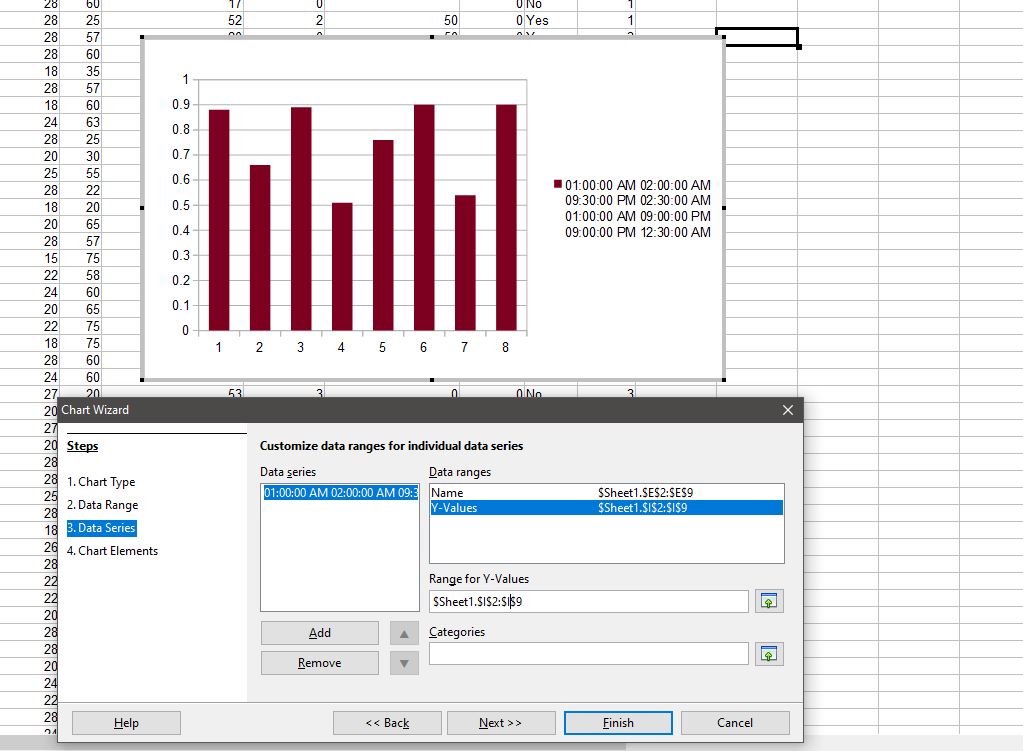
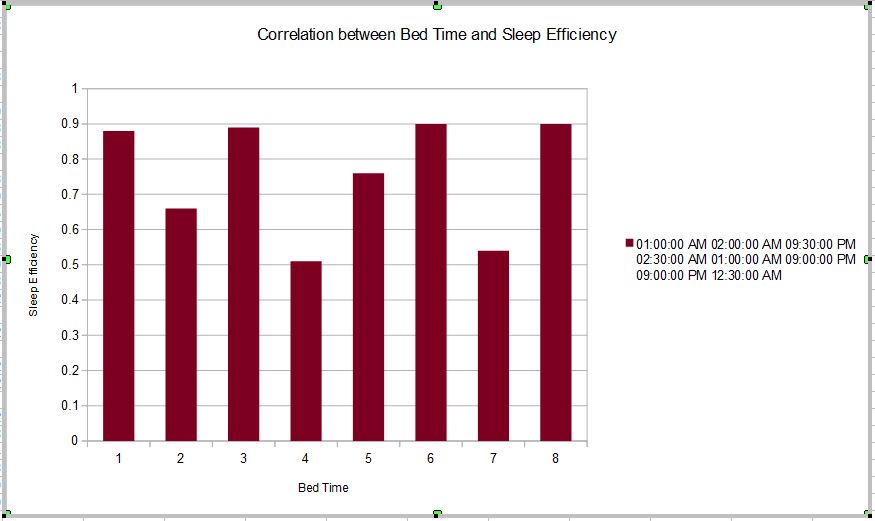
Bar-Chart
I wanted to get the hang of charting features in spreadsheets, in this example, I decided to use a bar chart, but once you know how to make one type of chart, you can essentially make them all.
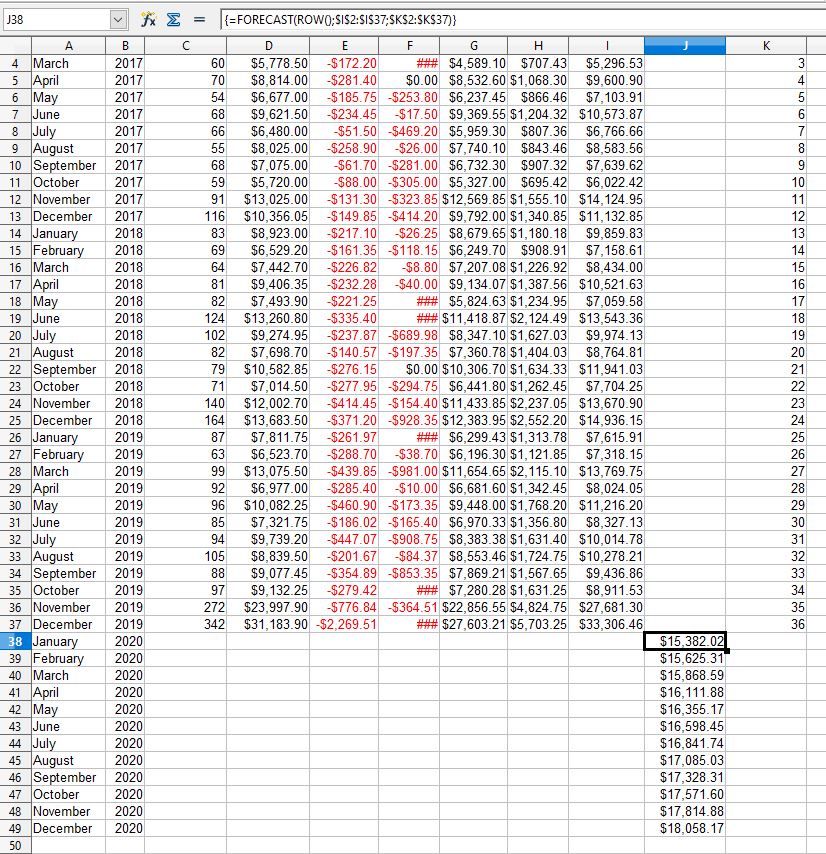
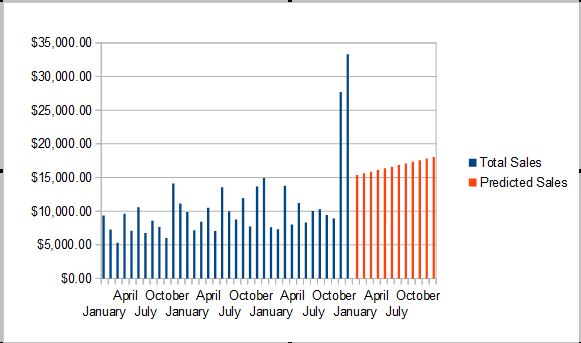
Forecast
The forecast function is pretty interesting, it uses the following theorem to calculate the average value of future numbers based on two preexisting values:
it’s typically used to calculate future potential costs and profits.